Welcome to CanadianHedgeWatch.com
Tuesday, June 23, 2026

Hedge Fund Investing and Holding Trends for Q4 |

Date: Tuesday, February 24, 2009
Author: Tyler Durden, Seeking Alpha.com
As the October Volkswagen debacle demonstrated all too well, keeping a tab on crowded hedge fund positions is important to avoid six sigma type blow ups. Furthermore, as hedge funds tend to (generally) be better early indicators of overall market direction, it is useful to keep track of investing trends within the hedge fund community.
What
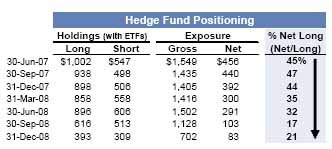
do the most recent numbers indicate? Based on an analysis of 675
publicly-disclosing hedge funds (via 13 D/F/G filings), the HF
community has dramatically toned down its bullish tone, and long
holdings currently amount to $393 billion at the end of December 2008,
down 36% from September, while short holdings total $309 billion, down
40% from the previous quarter (click on chart to enlarge).
Gross exposure in the June 2007 - December 2008 period has declined
from $1.5 trillion to $700 billion, with net long exposure declining
from 45% to 21%, although rising from the September 2008 low of 17%.
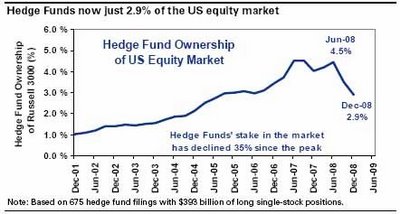
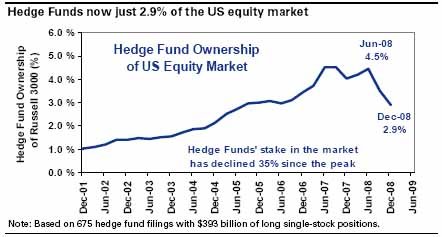
Additionally,
hedge fund stock ownership accounted for "only" 2.9% of the US equity
market, a stark drop from 3.5% in September and a peak of 4.5% in June,
implying the threat of ongoing hedge funds deleveraging may be
subsiding (click on chart to enlarge).
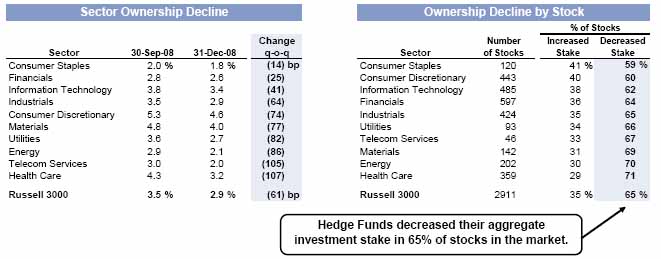
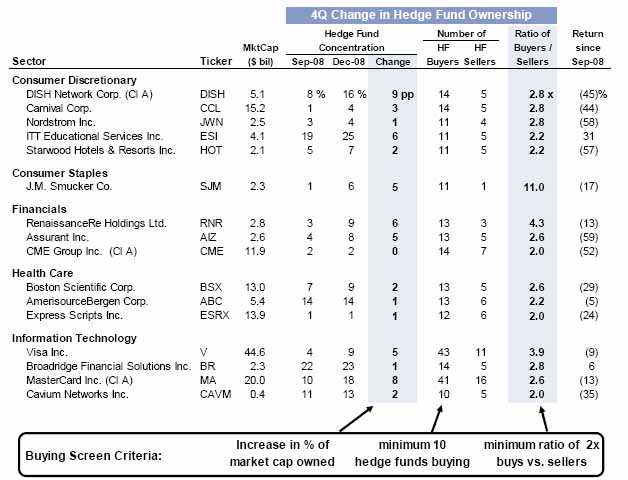
While hedge fund turnover reached a 7 year high of 40% in Q4, a set of 16 stocks was actively bought in the quarter. 11 of the 16 stocks are in the consumer discretionary, financials and information technology industries, sectors that outperform most during an equity market recovery. Keeping in mind the stock market performance so far in Q1 2009, this may have been yet another misguided attempt to time the market bottom. Otherwise, sector exposure did not change significantly in Q4 as funds proceeded to sell the market broadly: HFs had the highest net long exposure to telecom services and materials and a net short position in financials. In summary HFs decreased their ownership in 65% of the stocks in the market (click on chart to enlarge).
While hedge fund turnover reached a 7 year high of 40% in Q4, a set of 16 stocks was actively bought in the quarter. 11 of the 16 stocks are in the consumer discretionary, financials and information technology industries, sectors that outperform most during an equity market recovery. Keeping in mind the stock market performance so far in Q1 2009, this may have been yet another misguided attempt to time the market bottom. Otherwise, sector exposure did not change significantly in Q4 as funds proceeded to sell the market broadly: HFs had the highest net long exposure to telecom services and materials and a net short position in financials. In summary HFs decreased their ownership in 65% of the stocks in the market (click on chart to enlarge).
The
buying basket was determined by focusing on non-macro funds, or hedge
funds that use fundamental analysis in their stock picking rationale.
HFs selected were ones that have 200 or fewer stock positions, and
criteria for basket participation were stocks in which hedge funds
increased aggregate ownership stakes with at least 10 HF buyers and at
least 2x more buyers than sellers. The 16 resulting stocks declined 26%
in the quarter compared to a 32% decline in the overall market, and
while exact purchase times during the 3 month period can not be
certified, the buying pressure certainly led to the basket's
outperformance (click on chart to enlarge).
The
biggest caveat is that the impact of hedge fund leverage and
concentration is still very dramatic, and should be carefully
considered when new positions are established. While not as dramatic as
the 5x price swing from the forced short-cover rally in VOW, in Q4
demonstrated specific stock underperfomance as a result of concentrated
holdings and the resulting deleveraging.
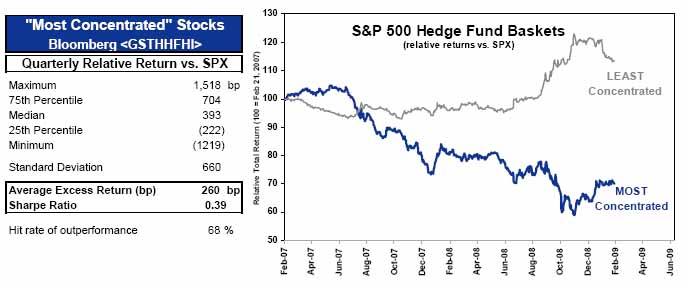
Not
surprisingly, the strategy of concentration is not new, with many mimic
funds available that merely replicate the positions of other previously
"established" managers such as Buffett, Perry or Gandell. Since 2001,
the strategy of buying the 20 most concentrated stocks has outperformed
the market on average by 260 bps per quarter. And as is to be expected,
the strategy performs poorly in time of high volatility or declining
markets.
In Q4, the concentrated holding basket
underperformed the market by 834 bps, and since the market peak in
October 2007, underperformed the market by 1,041 bps. The obvious
conclusion is that selling pressure has put additional downward
pressure on concentrated stocks. Another by-product of stock
concentration is that it is a good proxy of hedge fund leverage. As
funds were net long only 21% most recently, there may be less selling
of concentrated stocks going forward, however the likelihood of
accelerating redemptions due to recent de-gating at many funds, will
likely compensate for core deleveraging (click on charts to enlarge).
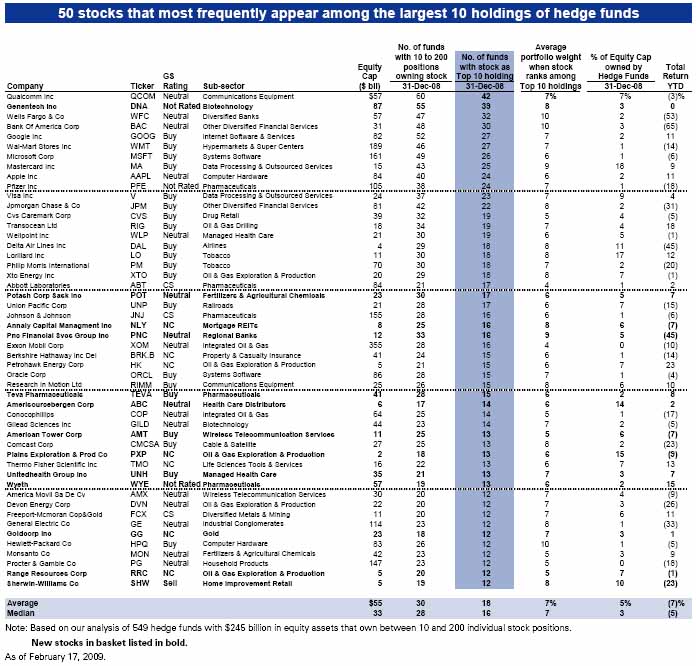
Taking the basket analysis one step further, leads to the emergence of the core stock "Target List" representing the largest holdings of fundamental strategy hedge funds. The Target List consists of names that most frequently appear in the top ten holdings of hedge fund portfolios, and identifies 50 stocks whose performance will influence the long side of many fundamentally driven hedge funds. Turnover in the List was relatively low in the last quarter, with 13 new stocks entering the List, while on average 16 stocks enter the List every quarter. The Target List offers an efficient vehicle for investors seeking to "follow the smart money" based on hedge fund filings.
The
basket has a large-cap bias with a median market cap of $33 billion,
and consists of stocks from every sector except utilities. The Target
List has outperformed the S&P 500 by 56 bps on a quarterly basis
since 2001, with a 0.21 Sharpe ratio. And, as expected, the basket has
demonstrated significant losses since June 2008 (click on chart to enlarge).
Based
on January hedge fund data, the reason for HF outperformance has to be
sought not on the long side, but rather on the short. The $309 billion
estimate of short positions is based on a 85% assumption of HF holdings
in the total $364 billion of single-stock, ETF and market index short
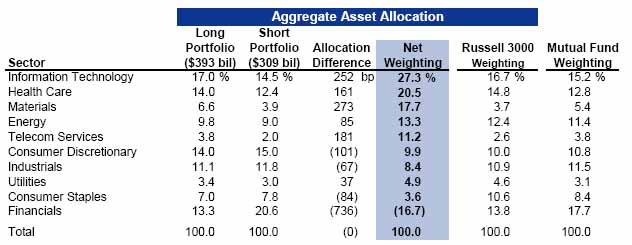
positions filled with exchanges. The table below (click to enlarge) represents estimated hedge fund long, short and net exposure by sector in $ billions.
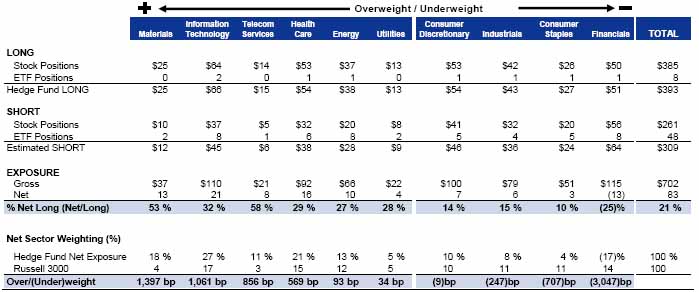
Preliminary observations indicate that based on relative asset allocations, hedge funds were predominantly net long weighted to information technology, health care and materials, with financials being the only sector with a substantial net short exposure. Financials is also where mutual funds and hedge funds diverge the widest, as the former have a net long estimated exposure to the tune of 17.7%, a 34.4% positional discrepancy between the two investor types (click on chart to enlarge).
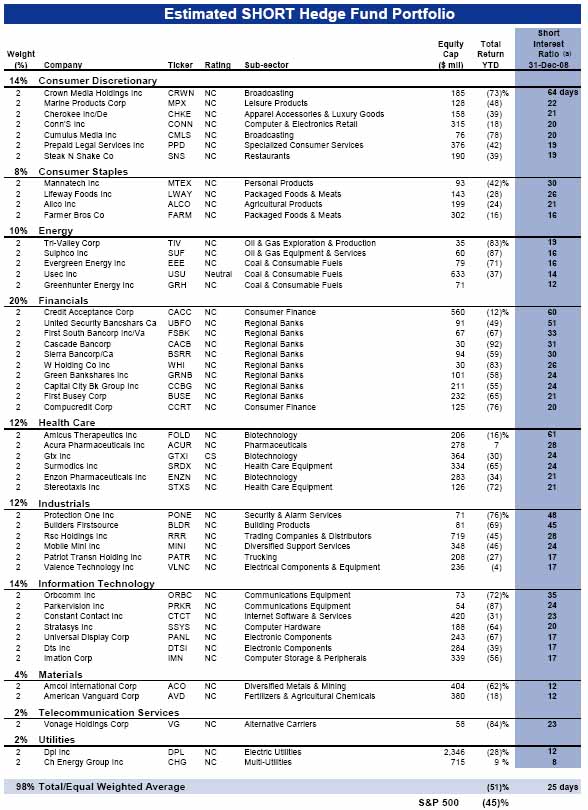
The tables below (click to enlarge) attempt to extrapolate a typical long and short hedge fund portfolio based on the most recently available holdings data.

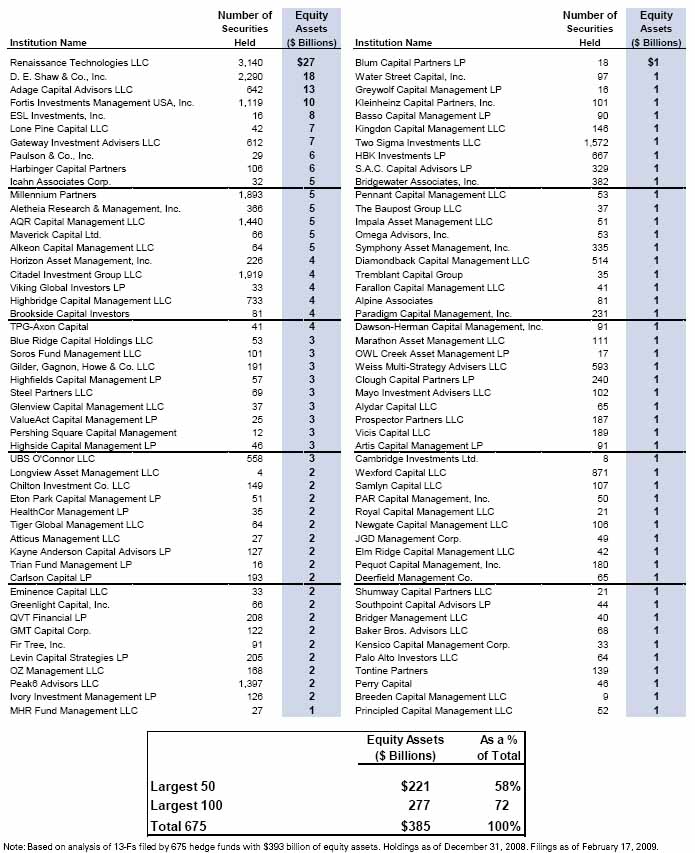
Lastly,
if readers are interested in recreating a fully representative
portfolio of a typical fund, below (click to enlarge) we present the
100 largest hedge funds ranked by long equity assets, as well as
demonstrating the number of securities held.
Copyright © Canadian Hedge Watch Inc. All rights reserved.
Reproduction in whole or in part without permission is prohibited.
Reproduction in whole or in part without permission is prohibited.